Internet of Things on Bluemix

Internet of Things on Bluemix
By 2020 there will be 50 billion Internet of Things (IoT) devices, it’s a very huge number and I’m very happy to belong to the IBM’s Internet of Things division. In this article I’m showing you how to manage an IoT device on IBM Bluemix cloud platform.
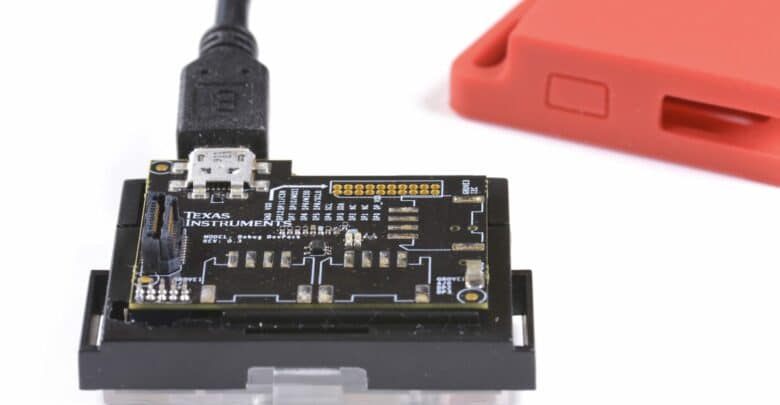
In details I’m showing you how to connect my Texas Instrument SensorTag to the cloud , the SensorTag devices allows quick and easy prototyping of IoT devices. I connected my sensor to the cloud in ten minutes. In this image there are the main features of SensorTag, so I am able to catch the environment temperature, the environment light and the air pressure:

My SensorTag has only Bluetooth wireless technology therefore I used my smart phone as wi-fi hotspot to send the sensor data in the cloud. By TI android application I am able to send sensor data to IBM IoT Cloud service, using the service quickstart:

After configured my IoT device I worked on Bluemix to manage the sensor data. I used the node-RED application to handle the data flow from real-life environment. Get started with my Internet of Things project:

In node-RED environment I created a simple flow to fetch data from the sensorTag device. By a debug node I displayed the raw data on the debug window, by a web dashboard node I displayed the data in a cool panel.
To get input from IoT device I used as input node the IBM Internet of Things Foundation node:

To match the service cloud configured on sensorTag, the authentication in the IoT node is quickstart type and the Device Id is my sensorTag id. The IBM Internet of Things Foundation is a fully managed, cloud-hosted service that makes it simple to derive value from IoT devices. When you start with your device, be it a sensor, a gateway or something else, using this node to get it connected and start sending data securely up to the cloud using the open, lightweight MQTT messaging protocol. From there, you can setup and manage your devices using your online dashboard or our secure APIs, so that your applications can access live and historical data fast.
The input node receives events sent from devices, receive commands sent to devices, or receive status updates concerning devices or applications. It produces an object called msg and sets msg.payload to be a string containing the payload of the incoming message. I wired the input node with a debug node to check in real-time the data sent from my device:

In this way I able to see the JSON associated to my msg.payload, It was hot in my house: 22 Celsius !
To display the data on a web dashboard I wired the input node to the freeboard node:


Freeboard node enables a web real-time dashboard on your node-RED application. In my environment at the dashboard URL:
http://thethinredline.mybluemix.net/freeboard/
During the freeboard configuration you can use the datasource that match with the freeboard node used in the node-RED flow:

Here the sensor data (in real-time) at the end of the configuration:

The combination of cloud computing and IoT it’s very interesting, moreover Internet of Things on Bluemix it’s very very cool.
I think I will have fun with these technologies 🙂
Your Feedback is Welcome.
7 Comments